PinnedHow to Create a Tensorflow Environment in Jupyter Notebook and Use it?Anaconda will enable you to create virtual environments and installl packages needed for data science. With virtual environments, you can…Aug 25, 2021210Aug 25, 2021210
PinnedPublished inNerd For TechQuora Question Pairs Similarity ProblemSolving Real-World Problem Using Text Analytics and Classical Machine Learning Approach!May 2, 2021210May 2, 2021210
PinnedPublished inNerd For TechWhat is the Standard Normal Distribution and how do we interpret it?What is so special about normal probability distribution? Why do so many data science and machine learning articles revolve around normal…Aug 24, 2021125Aug 24, 2021125
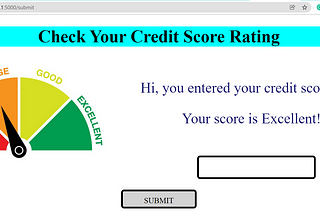
Published inPython in Plain English🚀Build and Deploy ML Web-App in Python’s StreamlitAn intuitive style of building an ML web app using python streamlit library.Jan 10, 20222112Jan 10, 20222112
Published inGeek CultureCreate Basic Web Application 🖥️ and 🚀Deployment🚀 Using Python!!Hello Guys!!! 🤗Jan 9, 2022120Jan 9, 2022120
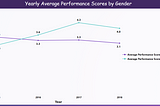
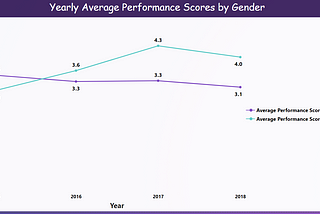
Line chart for average performance metric by category using DAX — PowerBIFriends, let us understand the DAX formula for finding the average performance metric with a simple example.Sep 24, 2021119Sep 24, 2021119
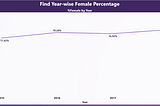
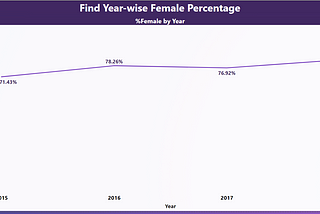
Find Percentage of Female from Gender Column — Power-BIFriends, there is a very simple formula to find female or male percentages from a gender column.Sep 23, 2021861Sep 23, 2021861
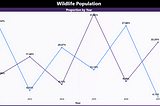
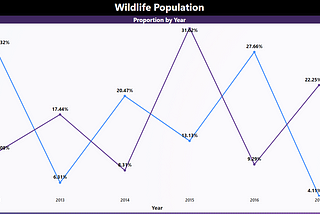
How to show distribution % by legend on a lines chart in PowerBI?Hi guys, PowerBI is easy to learn but a bit complex visual requirements sometimes trouble us! Let’s see the story of Jack!Sep 22, 20213Sep 22, 20213
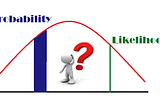
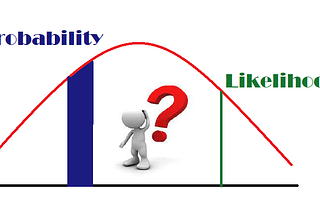
Published inNerd For TechWhat is the difference between Probability and Likelihood?Let us understand these two statistical terms in an easy way!!Aug 20, 20212202Aug 20, 20212202
Published inNerd For TechHR Analytics — Job Change of Data ScientistsMachine Learning Approach to predict who will move to a new job using Python!Aug 12, 2021344Aug 12, 2021344